
New Institutional Report Released
Access our strategic market perspective on necessity-based real estate and private credit fundamentals.
Read Full Report
U.S. commercial real estate investment volume reached $250.3 billion in the first half of 2026, up 21% year over year, with Q2 alone at $124.5 billion (+15%), according to CBRE's Q2 2026 Capital Markets report. CBRE projects the full year finishes up 16%, led by multifamily (+20%) and retail (+17%).
That's a market that reopened.
Two things belong in the same sentence, though. First, MSCI Real Capital Analytics puts Q2 volume at $113.7 billion, +9% — about $11 billion below CBRE's count, a methodology gap around deal-size thresholds and entity-level treatment. Second, and more useful: MSCI notes the quarter was flattered by three take-private entity deals. Strip those out and underlying single-asset volume is softer than either headline suggests.
So: the market is transacting again. It is not transacting as broadly as one number implies.
Here is the fact that should reframe how you read the rest of 2026.
Private real estate fundraising in H1 2026 totaled $92.6 billion — down 38% year over year, the weakest first half in nine years (PERE data, reported by Colliers, July 2026). Transaction volume is up 21%. Capital formation is down 38%. Those two things are happening at the same time, which means the recovery is being financed out of dry powder raised in prior vintages, not out of new allocations.
The nuance that rescues it is just as interesting: roughly 70% of funds are hitting or exceeding their targets, and the average fundraising period has compressed to 18.1 months from 23.8. Capital isn't retreating from the asset class. It's concentrating — into fewer sponsors, faster.
That is a very different market from 2021. In 2021, capital chased sponsors. In 2026, capital interviews them.
CBRE's Lending Momentum Index registered 1.0 in Q2 2026 — below Q1's 1.5, and below the 1.3 of a year ago. Lending momentum is falling while transaction volume rises. That combination tells you exactly how these deals are clearing:
LTV: 59.6%, down from 60.8%
DSCR: 1.43x, up from 1.34x
Debt yield: 10.2%, up from 9.7%
Average mortgage rate: 5.7%, down from 5.9%
Commercial spreads: 204 bps, tightened 21 bps year over year
More equity per dollar of asset. More cushion per dollar of debt. Slightly cheaper spreads as compensation. This is a deleveraging recovery — the structural opposite of the last one.
Worth noting who's actually lending: alternative lenders and debt funds hold 38% of non-agency closings, banks 30% (up from 24% — banks did not leave), life companies 21%, and CMBS has collapsed to 11% from 19%.
As of August 20, 2026 (Federal Reserve H.15):
Read the curve. The 2-year sits 56 bps above effective fed funds. The 30-year is at 5.23%. The market is not pricing cuts. CBRE has already withdrawn its assumption of two 2026 cuts and now expects the funds rate to hold.
Meanwhile, respondents to CBRE's H1 2026 Cap Rate Survey said the 10-year needs to reach 3.75% to meaningfully stimulate volume. It's at 4.69%. That's a 94 bps gap between where the market is and where the industry says it needs to be — and the 10-year is currently above its mid-May "peak" of 4.67%.
If your thesis requires rate cuts, it isn't a thesis. It's a wish.
Cap rates, for their part, have barely moved: all-property average ~6.6%, essentially flat versus H2 2025, with about 60% of survey respondents expecting no change over the next six months. Compression showed up most in neighborhood retail, then hotel, then industrial — and it was stronger for Class B/C and value-add than for core.
Green Street's Commercial Property Price Index was up 5.2% year over year in July 2026, with the all-property index sitting 14% below its 2022 peak. MSCI RCA's CPPI was up 0.9% year over year in Q2. On multifamily they disagree on direction outright: Green Street +3%, MSCI −1.7%.
Neither is wrong. Green Street is REIT-implied and forward-looking; MSCI is closed-transaction and 60–90 days stale. Most commentary quotes whichever one supports the argument being made. Read both.
Green Street's sector detail versus the 2022 peak is where the real story sits:
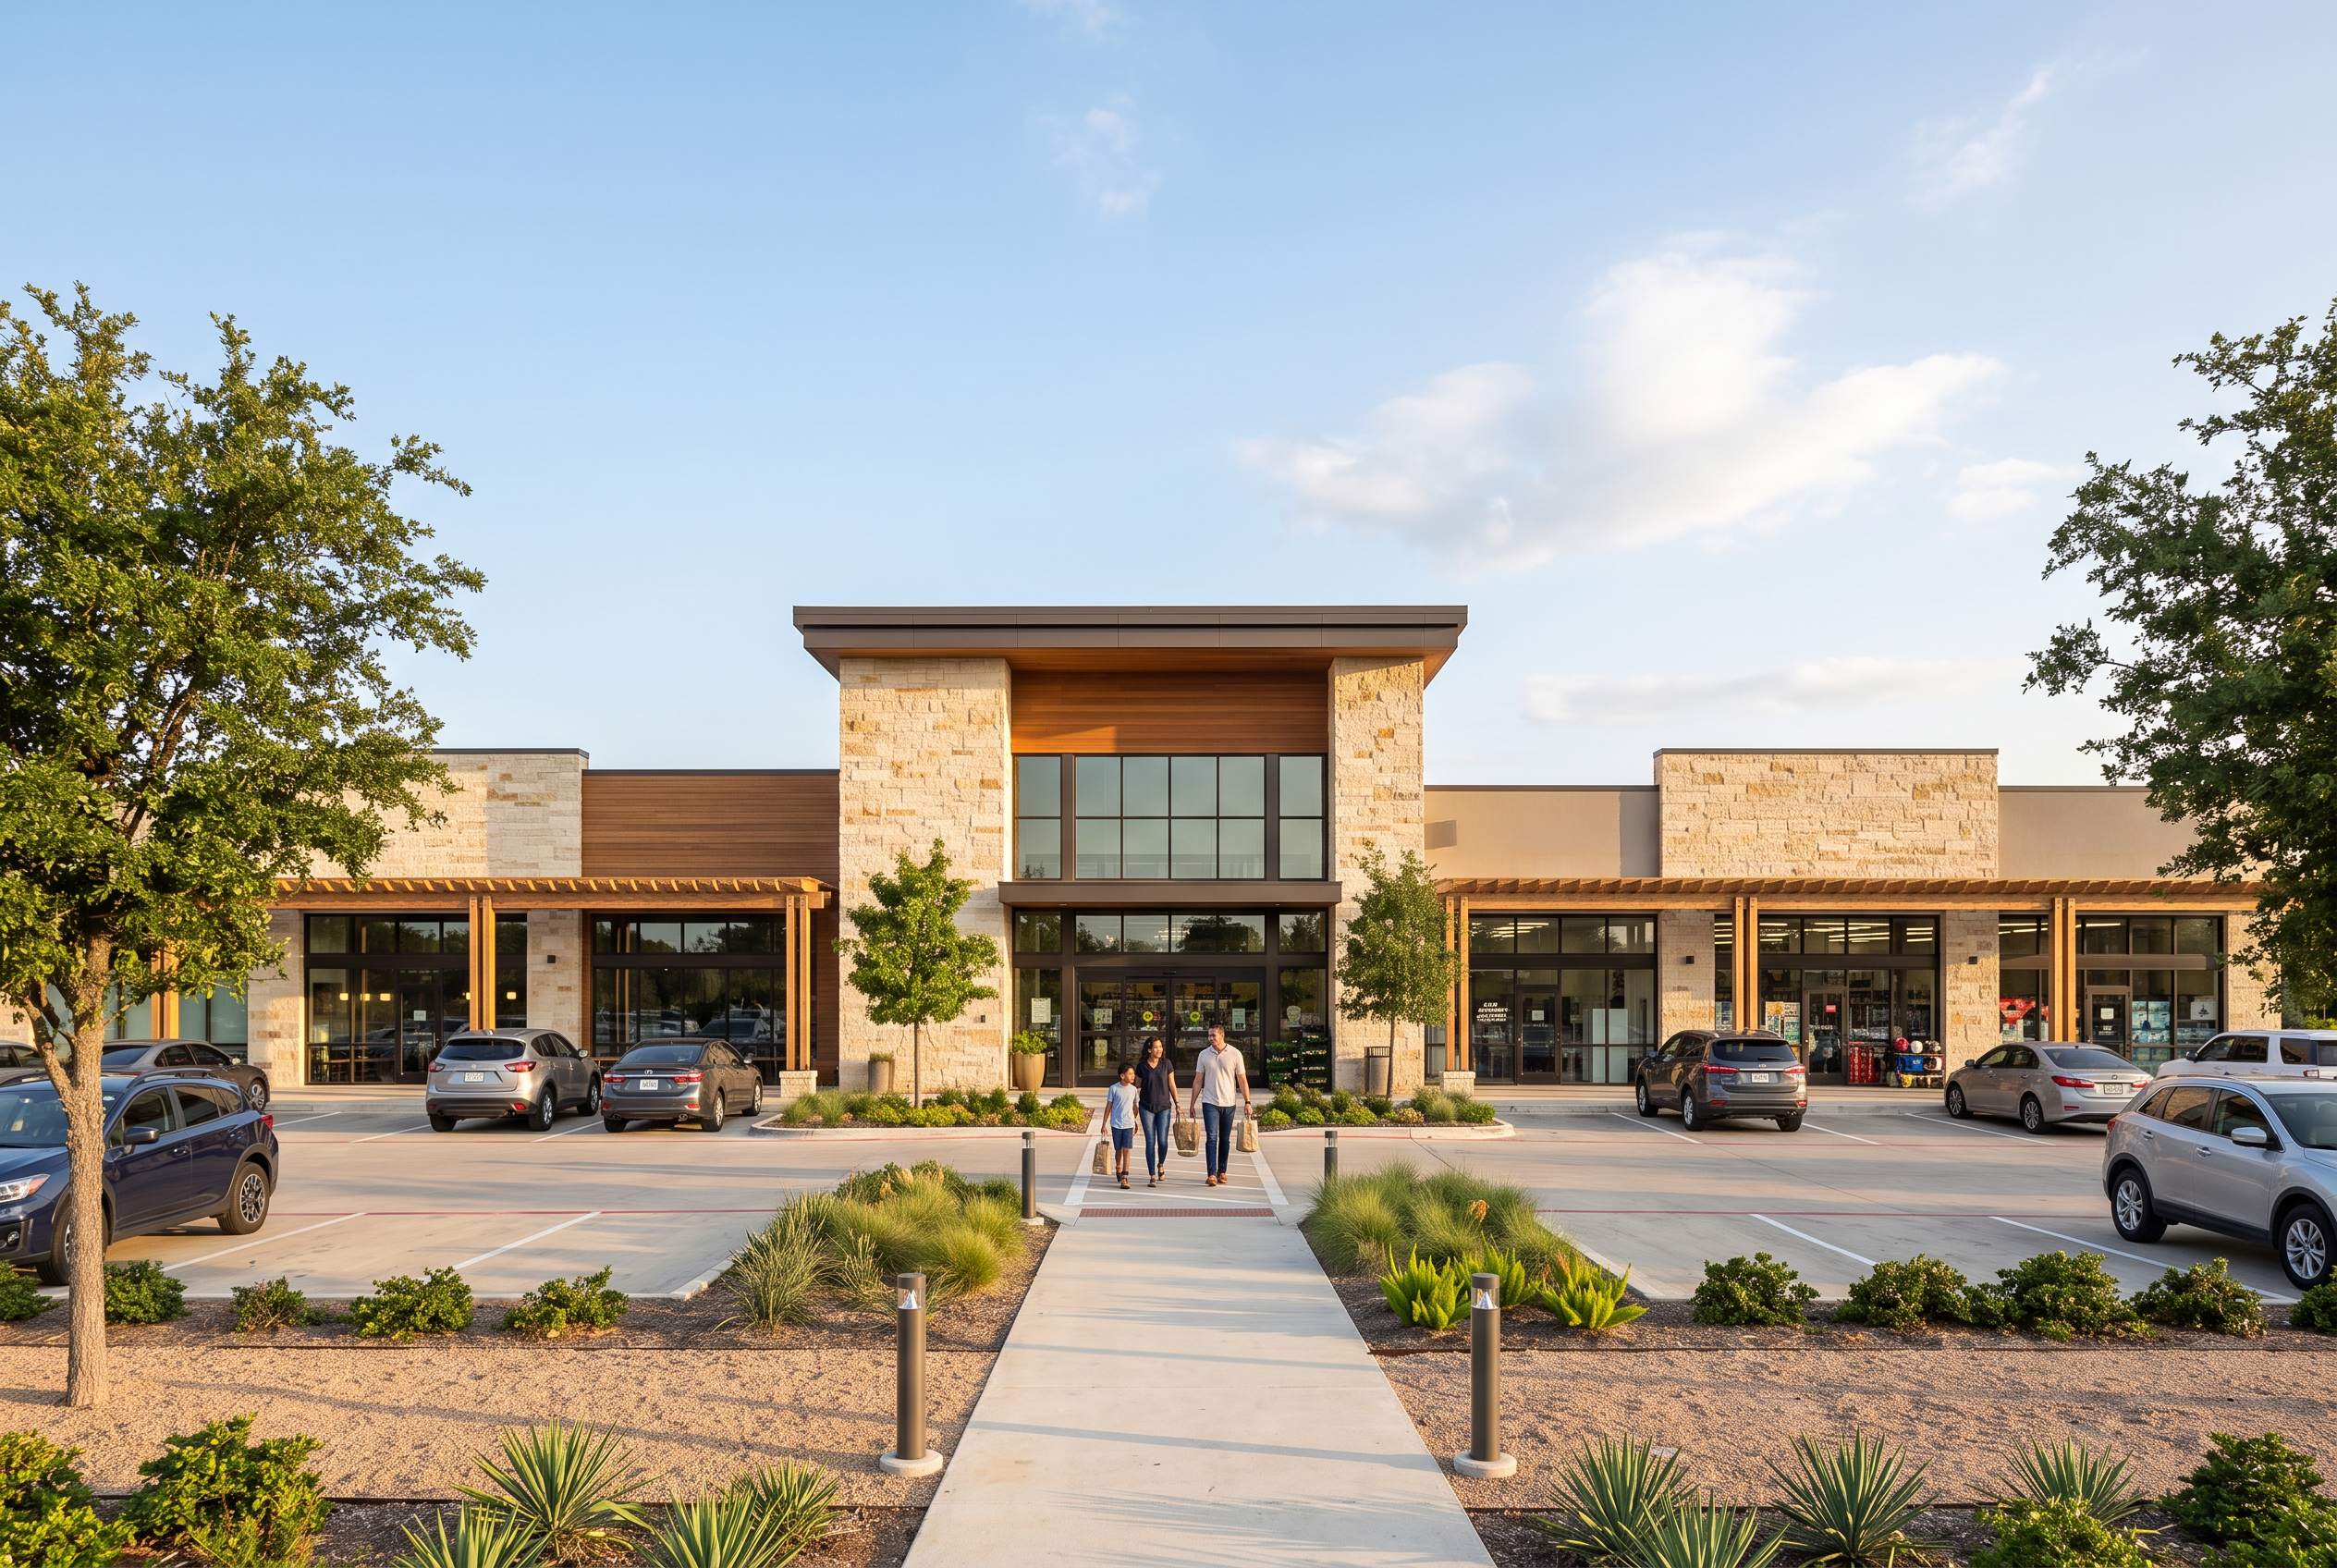
The consensus "beds and sheds" trade — multifamily and industrial — has underperformed the sector everyone declared dead in 2019. Retail is now 14% of all U.S. investment volume, a ten-year high (JLL), with trailing-twelve-month volume of $62 billion, up 31%. Retail debt now prices within 9 bps of industrial. Availability sits at 4.9% against historically low completions.
That is what a genuine repricing looks like on the other side.
$875 billion of commercial and multifamily mortgage debt matures in 2026 — 17% of the $5.0 trillion outstanding, and 9% below the $957 billion that matured in 2025 (MBA, February 2026). The wall is getting smaller.
And yet: Trepp's CMBS delinquency rate hit 7.86% in July 2026, up 51 bps in a single month — office 11.91%, multifamily 7.69%, retail 6.96%, industrial 1.13%. CRED iQ's broader distress measure reached 10.91%, a 2026 high.
Trepp's own attribution is the part to internalize: the spike reflects "refinancing challenges rather than property performance." The buildings are fine. The 2021 capital stacks are not. Anyone arguing "the wall is behind us" is watching the wrong variable — it was never the size of the wall, it was the rate at which loans clear it.
Insurance has inverted. After rising every quarter from 2021 through 2023, U.S. commercial property insurance rates fell 9% year over year in Q3 2025 following a calm catastrophe season, and the softening has continued into 2026 (Marsh Global Insurance Market Index). That flows straight to NOI, and almost nobody has repriced for it.
Replacement cost keeps climbing. CRE construction materials costs are running 6.0% above a 2024 baseline, with total project costs up 3.0% (Cushman & Wakefield, April 2026). Expensive new supply protects the value of existing supply. That is the quiet argument for owning what's already standing.
Four things.
OTIMA invests in income-producing U.S. real estate — necessity retail, medical, and multifamily — and commits its own capital in every deal. We underwrite the downside first, then get excited. If you'd like to talk through how this market looks from the inside, a principal will take the call.
CBRE, Midyear Real Estate Outlook 2026 — full-year +16% forecast, sector forecasts, withdrawn rate-cut assumption. https://www.cbre.com/press-releases/cbre-midyear-real-estate-outlook-leasing-momentum-carry-into-second-half-year
Colliers / MSCI Real Capital Analytics, Q2 2026 volume commentary — $113.7B (+9%), entity-deal effect. https://knowledge-leader.colliers.com/steig_seaward/msci-q2-2026-entity-deals-lift-volume-as-sector-recoveries-diverge/
PERE, Real Estate Fundraising Falls to Nine-Year Low in H1 2026, July 10, 2026, as reported by Colliers Knowledge Leader, July 22, 2026 — $92.6B (−38% YoY), 18.1-month average raise period. https://knowledge-leader.colliers.com/steig_seaward/quick-hits-capital-raising-hits-nine-year-low-as-investors-stay-selective/
CBRE, U.S. Cap Rate Survey H1 2026 — ~6.6% all-property average, 3.75% Treasury threshold, sector compression detail. https://www.cbre.com/insights/reports/us-cap-rate-survey-h1-2026
CBRE, Commercial Real Estate Lending Fundamentals Remain Strong, Q2 2026 — Lending Momentum Index 1.0, LTV/DSCR/debt yield, lender share. https://www.cbre.com/press-releases/commercial-real-estate-lending-fundamentals-remain-strong-q2-2026-cbre
Federal Reserve, H.15 Selected Interest Rates, observation date August 20, 2026. https://www.federalreserve.gov/releases/h15/
Green Street, Commercial Property Price Index, July 2026 (+5.2% YoY) and June 2026 sector detail. https://www.greenstreet.com/resources/pricing-index/
MSCI Real Capital Analytics, RCA CPPI, Q2 2026 (+0.9% YoY all-property).
NCREIF, NPI and NFI-ODCE, Q2 2026 — NPI total return 1.29% (income 1.17%, appreciation 0.12%). https://www.connectcre.com/stories/ncreif-reports-improving-q2-returns-for-key-quarterly-indices/
Mortgage Bankers Association, 17 Percent of Commercial and Multifamily Mortgage Balances to Mature in 2026, February 9, 2026 — $875B of $5.0T. https://www.mba.org/news-and-research/newsroom/news/2026/02/09/17-percent-of-commercial-and-multifamily-mortgage-balances-to-mature-in-2026
Trepp, CMBS Delinquency Report, July 2026 — 7.86% overall, +51 bps MoM, sector detail, refinancing attribution. https://www.connectcre.com/stories/cmbs-delinquency-rate-adds-51-basis-points-in-july-2026/
CRED iQ, CMBS Distress, July 2026 — 10.91% distress rate. https://commercialobserver.com/2026/08/cmbs-distress-2026-cred-iq-2/
JLL, 2026 U.S. Retail Thematic Outlook and Investor Survey — retail 14% of investment volume, $62B TTM (+31%), lending spread parity. https://www.jll.com/en-us/newsroom/2026-us-retail-thematic-outlook-and-investor-survey-results
CBRE, Q2 2026 U.S. Retail Figures — 4.9% availability, $24.79/sf asking rent (+2.4%). https://www.cbre.com/insights/figures/q2-2026-us-retail-figures
Marsh, Global Insurance Market Index, Q3 2025 — U.S. commercial property insurance rates −9% YoY. https://www.marsh.com/en/services/international-placement-services/insights/global-insurance-market-index-q3-2025.html
Cushman & Wakefield, The Impact of Tariffs on CRE Construction Costs, April 7, 2026 — materials +6.0%, total project +3.0%. https://www.cushmanwakefield.com/en/united-states/insights/the-impact-of-tariffs-on-cre-construction-costs
Figures as of the dates cited. This material is for informational purposes only and is not an offer to sell or a solicitation of an offer to buy any security. All investments involve risk, including possible loss of principal. Past performance does not predict future returns.

Craig leads the strategic direction and investment operations at OTIMA Investments. With over two decades of institutional private equity and commercial real estate experience, he has overseen multibillion-dollar transactions across North American markets.